Coefficient of determination R2
The R2 represents the part of the variance that is captured (or “explained”) by a model.
\[R^2 = 1-\frac{\sum (y_i - \hat y_i)^2}{\sum (y_i - \overline y)^2}\]For more information, see linear regression.
When to use it?
It should be used to assess the strength of a model to predict new values. The model per se is $X \hat \theta$.
Now, it also makes sense to assess the linearity in finding the line that best fits the data. Indeed, if the line is found via OLS, we have the following relationship:
\[R2_{OLS} = \rho^2_{\hat y, y}\]Thus, if the R2 is high, it means that a line fits well the data. In other words, there is a linear relationship between the data.
If the model uses only one explanatory variable (with intercept) $y_t = \beta_0 + \beta_1 x_t + \epsilon_t$, then we have the following relationship:
\[R2_{OLS} = \rho^2_{x, y}\]Covariance Cov()
Theoretical formula: $\mathbb{E}[(X-\mathbb{E}[X])(Y-\mathbb{E}[Y])]$
Empirical formula: $\frac{1}{n}\sum(x_i-\bar x)(y_i-\bar y)$
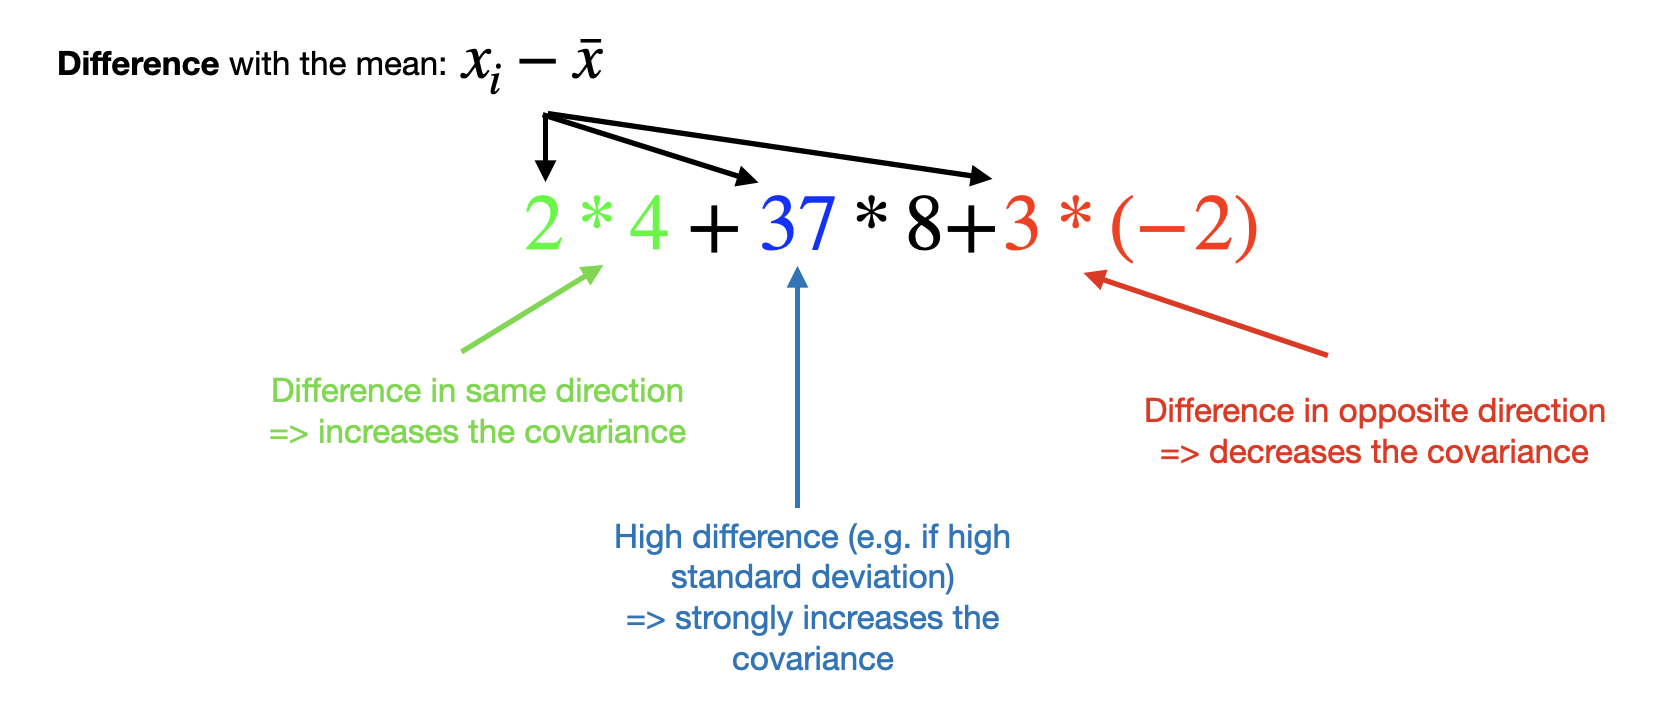
When to use it?
The covariance is difficult to use as is, because it has no lower/upper bounds. Moreover, the covariance is very sensitive to the scale as the blue coefficient shows above.
Correlation (Pearson) $\rho$
$\rho_{X,Y} = \frac{Cov(X,Y)}{\sigma_X\sigma_Y}$
When to use it?
The Pearson coefficient has the advantage to not be sensitive to the scale as showed by the formula’s denominator. Note: changing the scale means transforming the data as such $aX+b$. In other words, $\rho_{X,Y} = \rho_{aX+b,Y}$.
a1 = np.array([100, 20,  100,  30,  2])
b1 = np.array([1,   15,  200,  50,  1])

a2 = (a1-a1.mean())/a1.std()
b2 = (b1-b1.mean())/b1.std()

np.corrcoef(a1,b1).round(4)==np.corrcoef(a2,b2).round(4) # True
Mathematical proof showing that it has no effect to standardize the data before using the Pearson coefficient.
The Pearson has also the advantage to be bounded by $-1$ and $1$.
Warning (1): not sensitive to the scale doesn’t mean not sensitive to the magnitude! The more the variables move in the same magnitude, the more the Pearson coefficient is high.
Warning (2): $\rho = 0.5$ doesn’t mean that the two series are moving in the same direction 50% of the time (that would be the case with $\rho = 0$). It rather indicates a moderate correlation.
Regression coefficient
$Y = aX$
$a$ can be found through an OLS regression without intercept. The resulting line is forced to go through the origin.
When to use it?
Such regression can be used when we want to find the “best” $a$ and we don’t want to have an intercept (e.g. statistical arbitrage strategy).
Pearson coefficient VS regression coefficient
Let’s consider a univariate regression:
\[y_t = \beta_0 + \beta_1 x_t + \epsilon_t\]If $x$ and $y$ are standardized (mean=0, variance=1), we also have the following relationship:
\[\beta_1 = \rho_{x, y}\]from sklearn.linear_model import LinearRegression
from sklearn.preprocessing import StandardScaler
x = np.array([1,2,3,4,5,6])
y = np.array([0.1,0.3,0.5,0.4,0.7,0.9])
x_std = StandardScaler().fit_transform(x.reshape(-1, 1))
y_std = StandardScaler().fit_transform(y.reshape(-1, 1))
reg = LinearRegression().fit(x_std.reshape(-1, 1), y_std)
round(reg.coef_[0][0],4) == round(np.corrcoef(x,y)[1][0],4) # prints True