General remarks
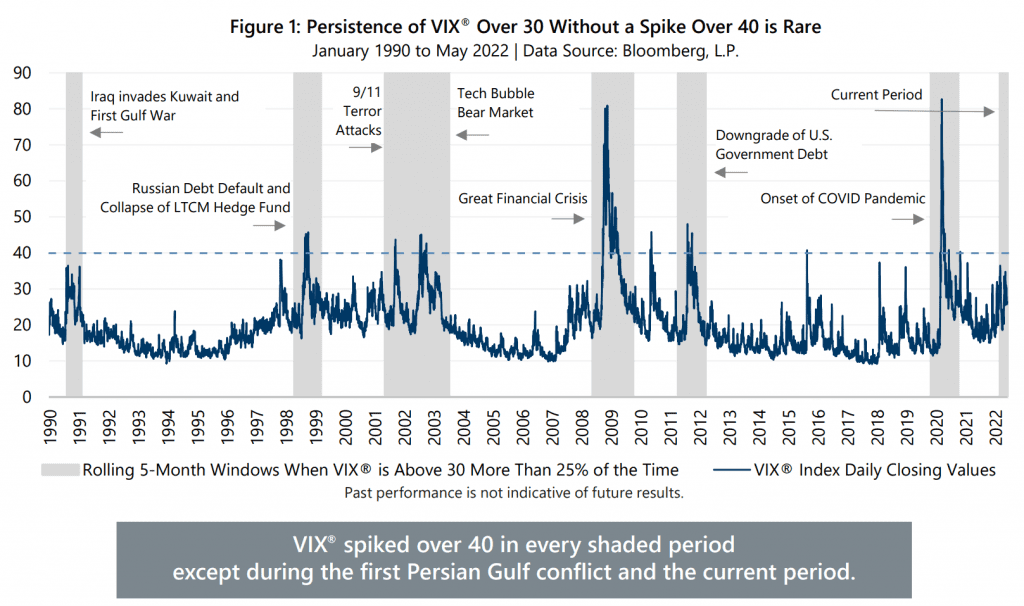
The VIX tends to be mean-reverting, meaning that it’s well predictable (cf Easy Volatility Investing).
Changes in volatility are negatively correlated with changes in market prices.
Days
“Sell in May and go away” —> historical tendency of the market to perform poorly during the summer months. Source: fastercapital.com (reliable?).
During the summer months: lower VIX levels. Source: fastercapital.com (reliable?).
Monthly patterns: historically, the VIX has been higher during the months of September, October and November. This is likely due to several factors, including the end of the summer vacation season, increased trading volume, and the potential for market-moving events like elections. Source: fastercapital.com (reliable?).
The VIX tends to be higher during the winter months. This is likely due to a combination of factors, including increased market activity and greater uncertainty around end-of-year financial results. Source: fastercapital.com (reliable?).
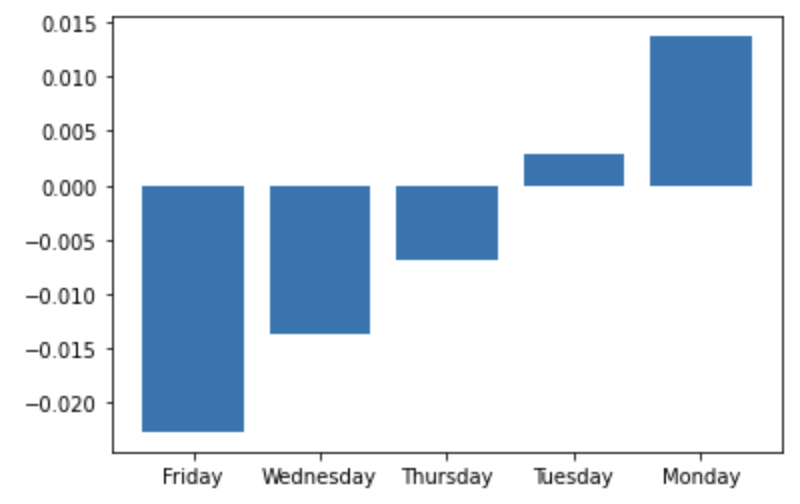
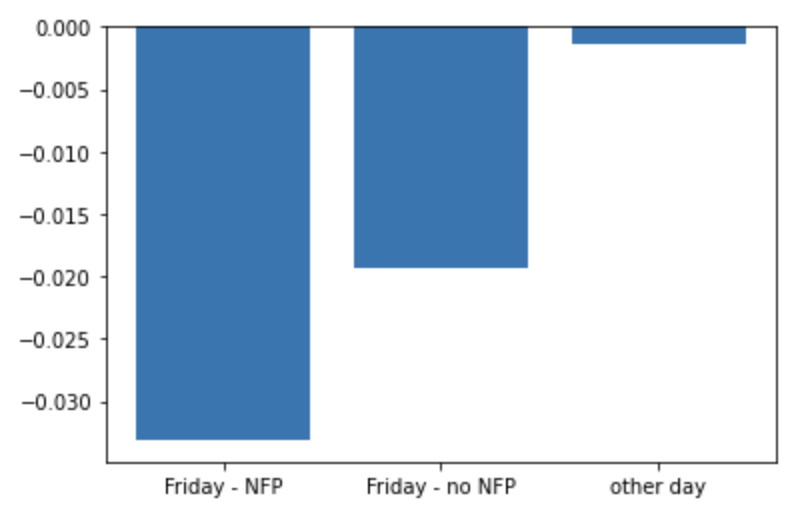
Weekly patterns: the VIX tends to be higher at the beginning of the week and lower towards the end of the week. This is likely due to the fact that traders are more cautious when a new week starts (i.e. more uncertainty) and tend to be more optimistic as the week progresses. Source: own analysis - below is the median of daily changes in the last 10 years. There are 64.36% chances that the VIX decreases on Friday (CI: 54.36%).
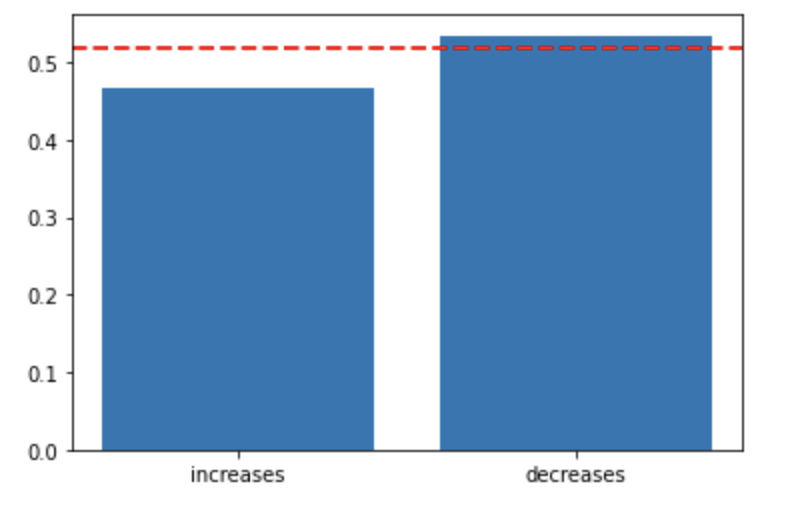
In general, we can also note that there were significantly more decreasing days than increasing days in the last 10 years (the red line is the significancy level).
Intraday patterns: the VIX tends to be lower during the first half-hour of trading and higher during the last half-hour of trading. This is likely due to the fact that traders are more cautious at the beginning of the day and tend to be more reactive towards the end of the day. Source: fastercapital.com (reliable?).
Event-driven patterns: the VIX tends to spike during events that could cause market volatility, such as political elections, natural disasters, and terrorist attacks. Examples:
Employment
There are 63.79% chances that the VIX decreases on NFP day (CI: 59.10%). Source: own analysis of the daily changes in the last 10 years.
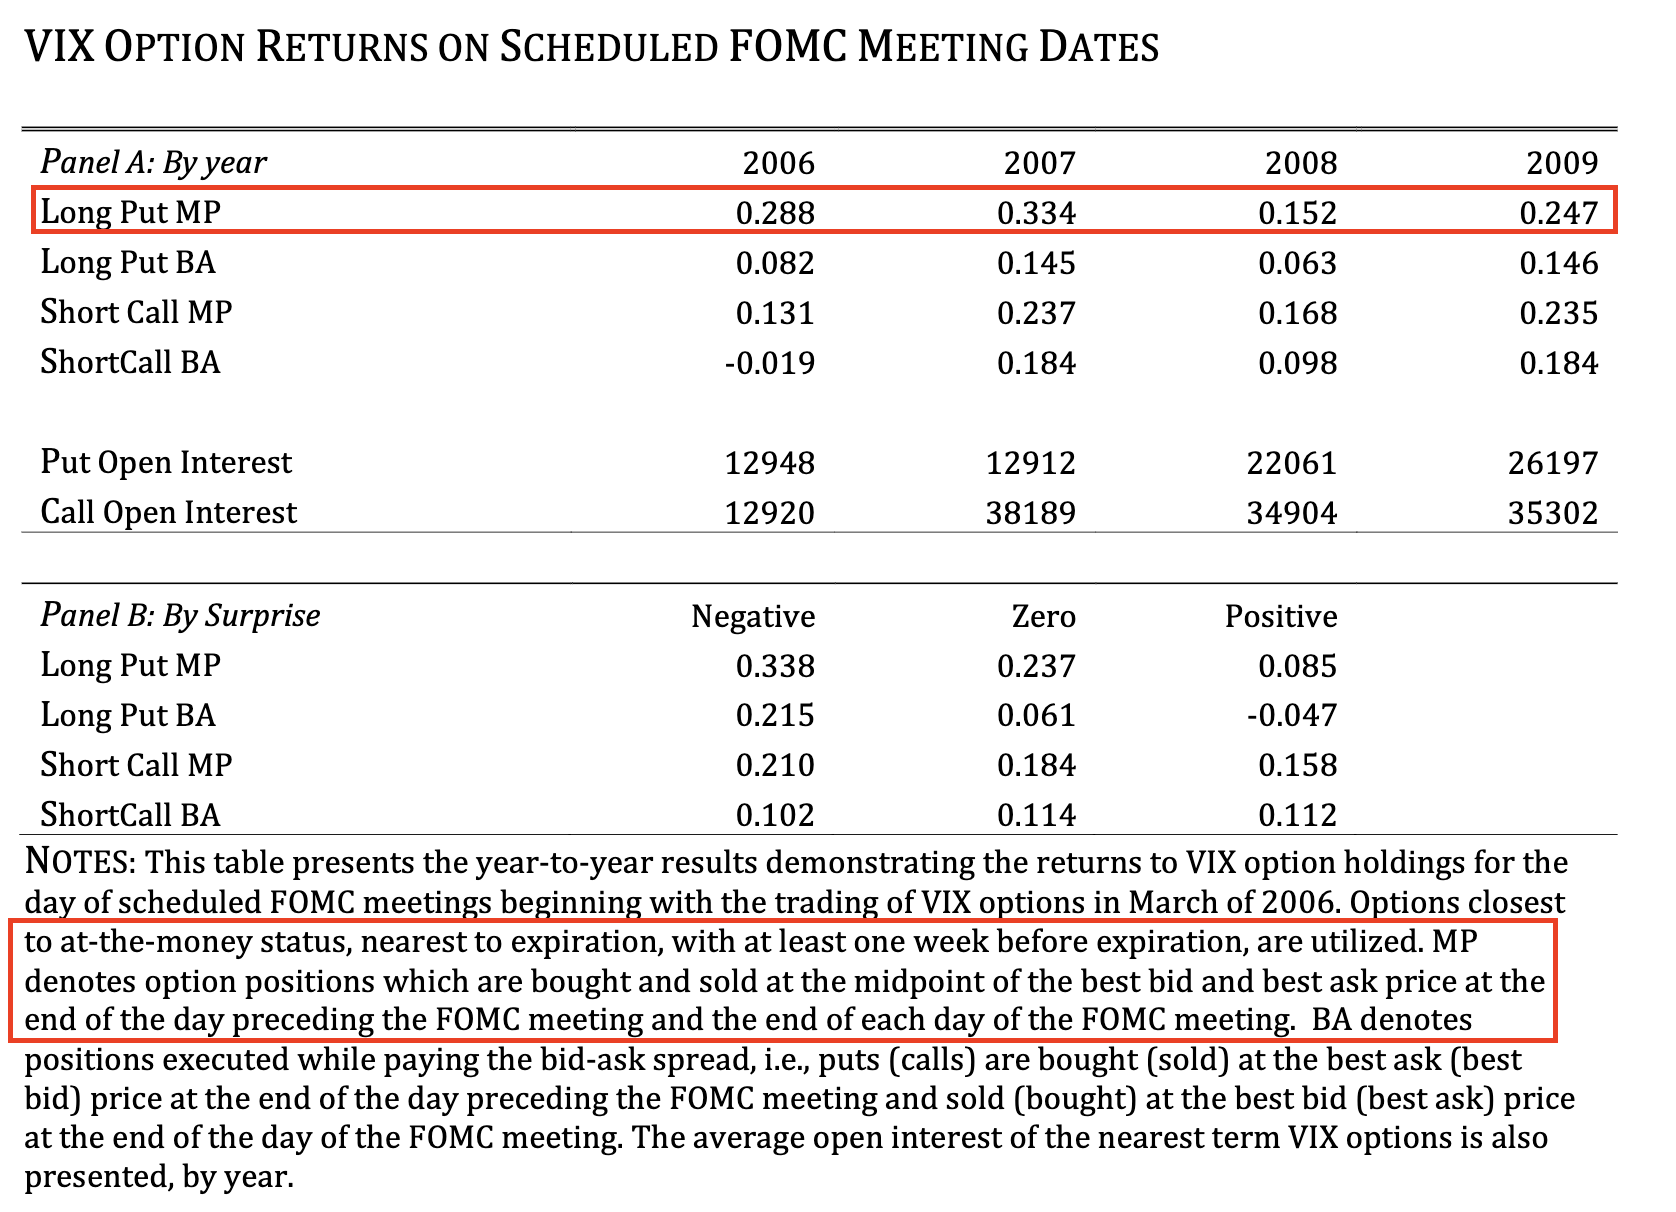
FOMC
“The results suggest VIX significantly declines on the dates of scheduled FOMC meetings. […] These results confirm the findings of Nikkinen and Sahlström (2004), Chen and Clements (2007), and Vähämaa and Äijö (2010) which find substantial decreases in VIX on FOMC meeting dates. […] We […] note this result does not depend on surprise announcements.” (cf The Uncertainty Resolution of FOMC Meeting Days). Below is the result of the strategy consisting in playing the news: