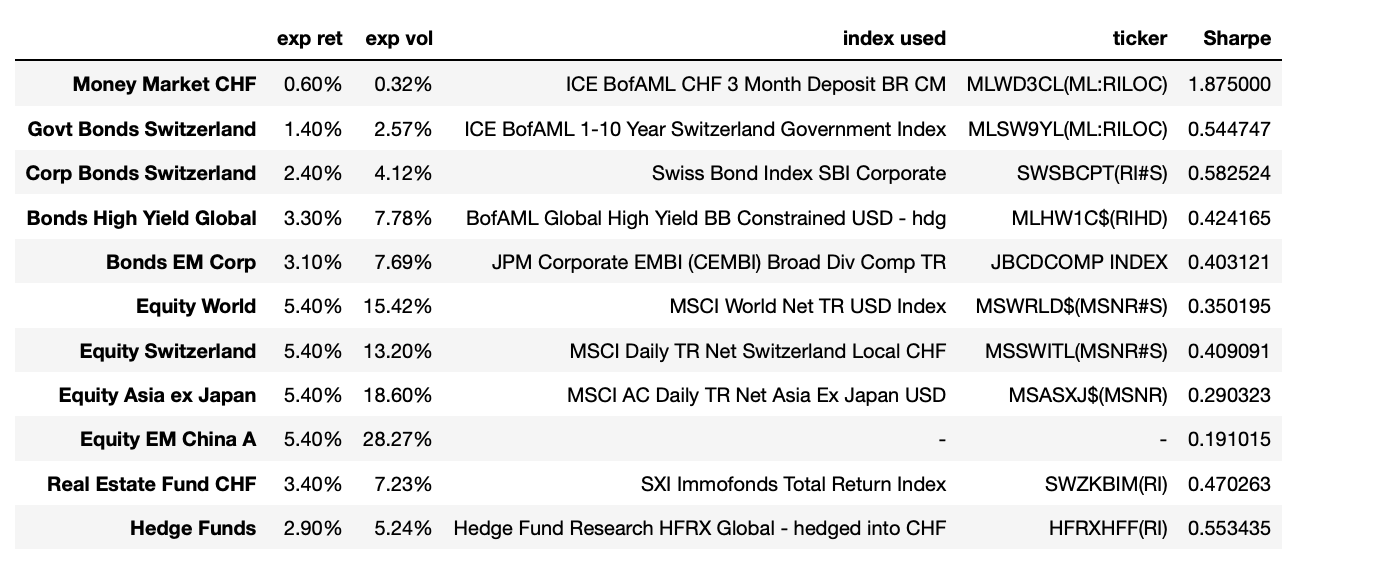
Expected figures (JB view)
The below figures are as of 30/06/2022. The expected volatility is the annualized monthly historical volatility computed on the range 31/07/2002-30/06/2022 (20 years). In other words, it is computed as such: $\sigma_{annual} = \sqrt{12}\sigma_{monthly}$.
Warning: the volatility is computed using the sample formula!
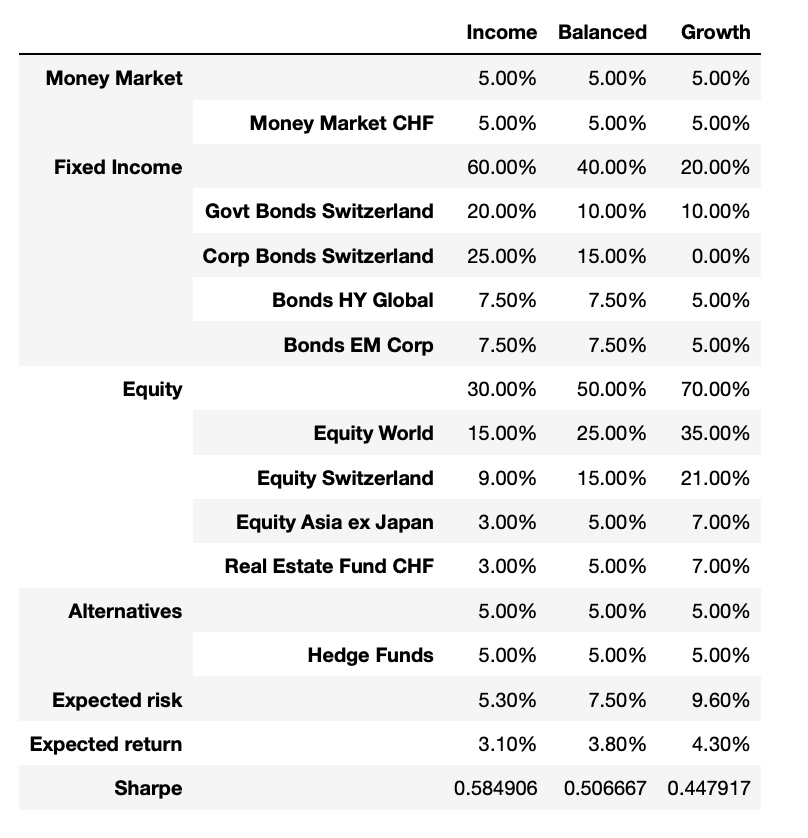
We note that investing in a diversified portfolio (i.e. following one of the strategy) allows to have a higher return as well as a higher Sharpe ratio than investing only in one asset class.
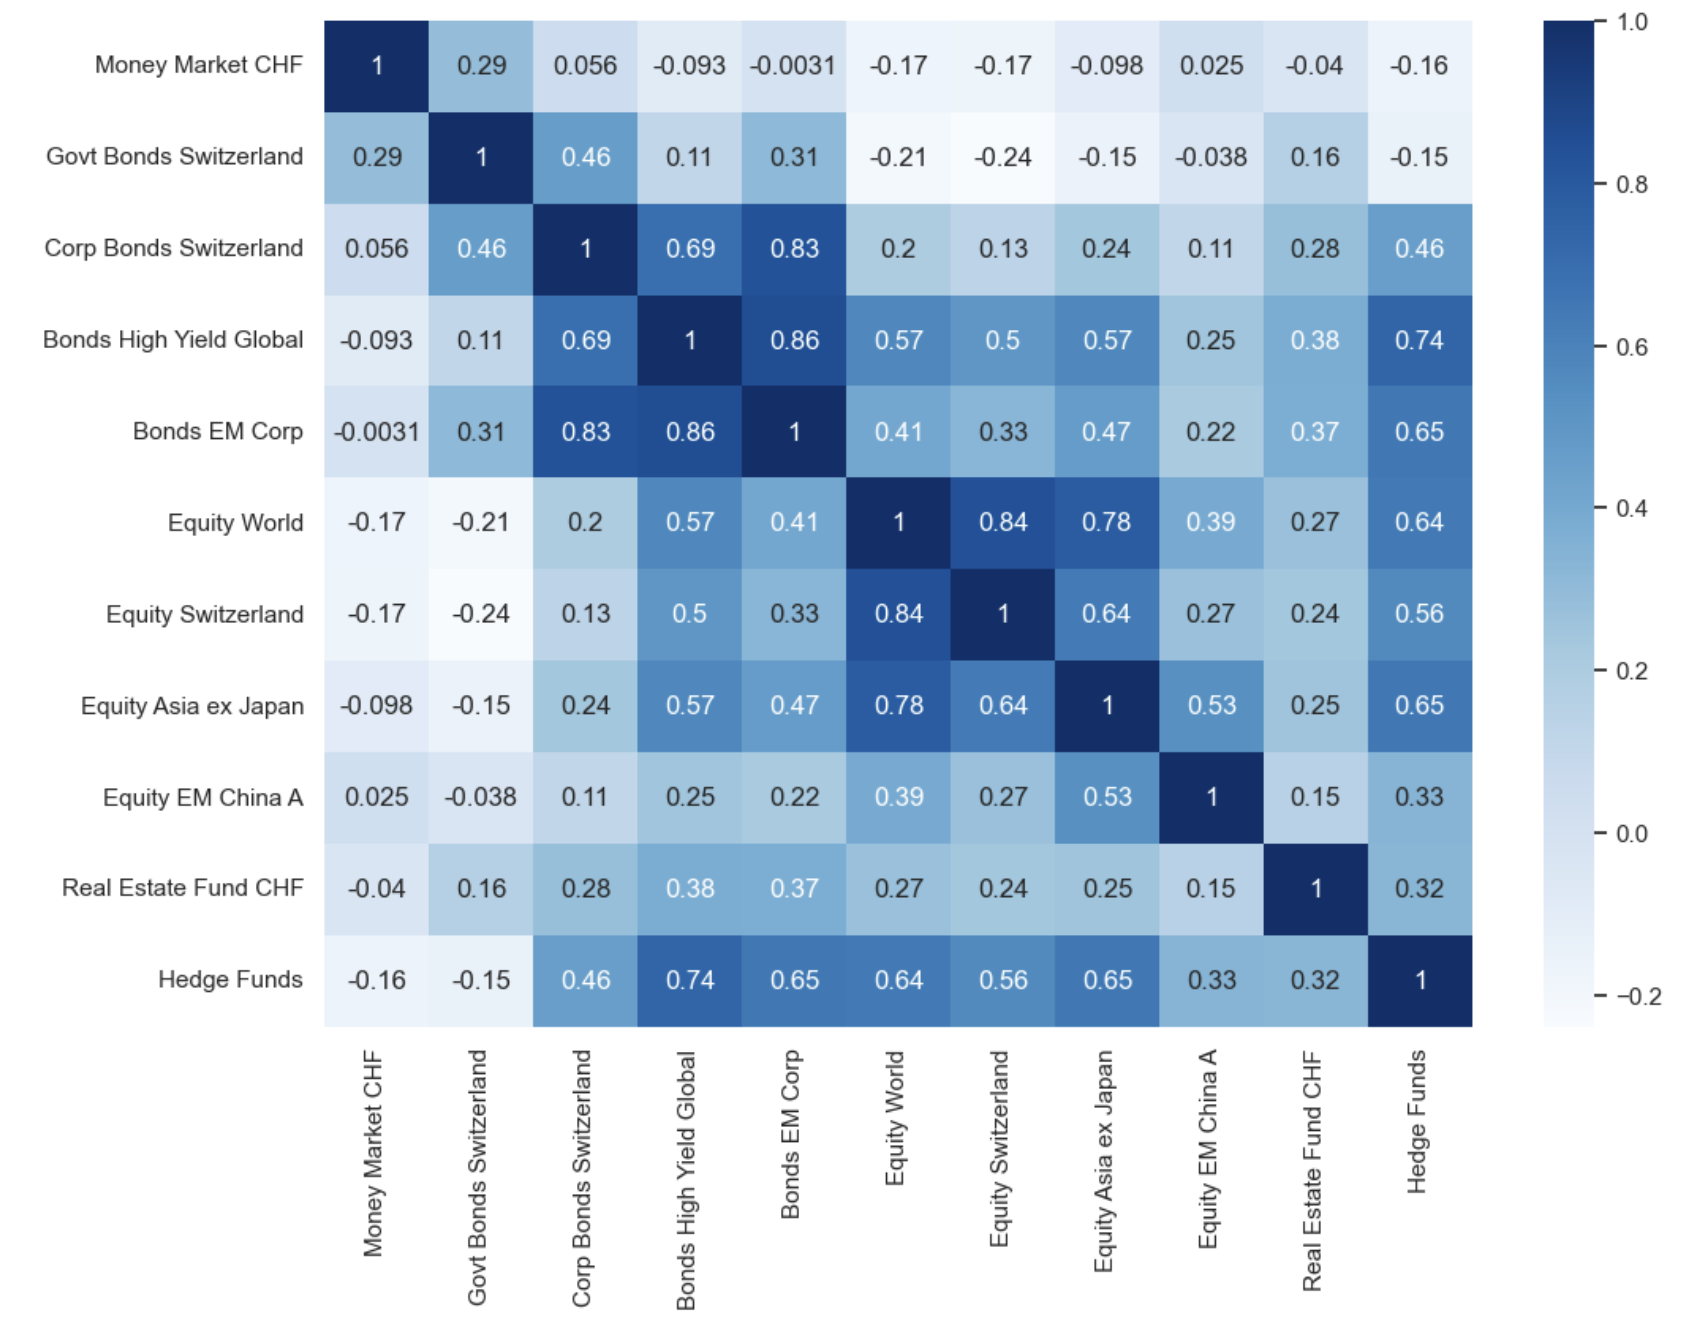
Correlations
We note that the Sharpe ratio is the largest for money market CHF products, although the expected return is quite low. Switzerland corporate bonds and, surprisingly, hedge funds also show a good ratio.
The correlation matrix is computed from monthly returns on the range 31/07/2002-30/06/2022 (20 years).
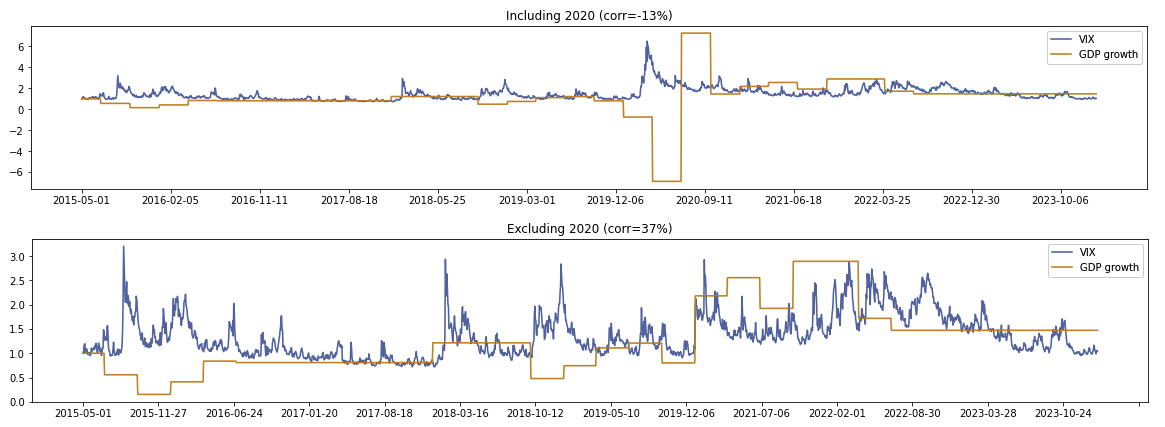
WARNING: correlations can be strongly influenced by a spike. Below is the correlation between the VIX and the GDP growth rate. We notice that the correlation changes strongly when excluding 2020 (covid crisis).
Patterns
-
From the above matrix, we note that the highest correlation is, without surprise, between bonds EM corporates and global HY bonds. We also note the highest negative correlation is between Switzerland equities and Switzerland government bonds. Note: the correlations would have been very different if we hadn’t included the financial crisis. Indeed, the crisis had the effect to substantially break correlations.
-
Oil and T-bills seem correlated.
-
Earnings seasons are often associated with high volume. It’s quite clear for some stocks like Netflix:
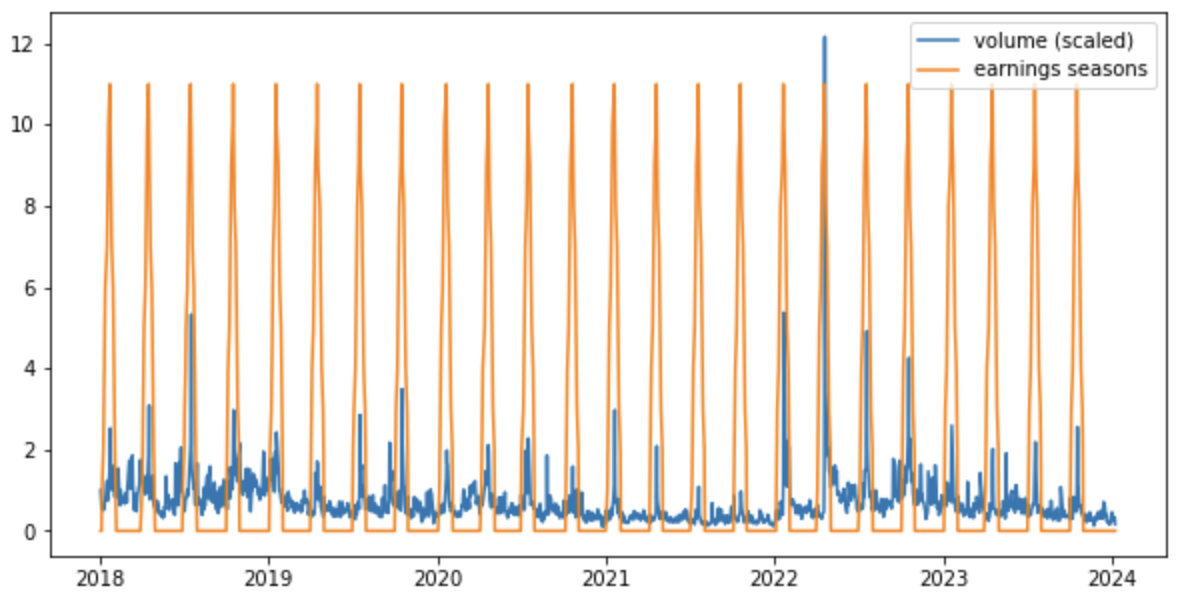
Note: earnings seasons can be modelled as such: 0 when we are far from an earnings season, and increasing/decreasing integers when we are approaching/moving away from the earnings seasons. E.g. 0 0 0 0 1 2 3 2 1 0 0 0 0 with 3 the day of the earnings announcement (window of +/- 2 days). When modelled as such in the case of Neftlix (5 years history, daily prices), we have corr(volume, earnings) = 40% (earnings window +/- 10 days).
-
When the VIX is decreasing, it’s usually associated with a strong sell-off.
-
Central banks tend to cut rates when they want to stimulate the economy. Cut rates => saving rates are less attractive => clients start to borrow and spend money in the economy => prices rise.
-
When investors anticipate an interest rate cut, the stocks may increase because investors anticipate the cut. Indeed, once interest rates are low, it means the consumption will become higher and, as a result, it will likely positively impact the economy (shares go up).
-
During inflation time, central banks tend to increase rates so that people spend less money => prices’ increase slow down.
-
Non farm payrolls announcements are every first Friday of the month. When the numbers are bad, this could indicate that the Fed will cut rates to stimulate further the economy. Consequently, investors tend to buy bonds before a potential rate cut => bond prices increase => yields decrease. When the numbers are high, it means that there might be further inflation => the likelihood for a Fed rate hike increases.
-
When investors anticipate high inflation, they typically sell their bonds because they want higher returns to compensate for the lower purchasing power. As a result, bond yields climb when investors anticipate high inflation.
-
Other important factors impacting the economy: presidential elections, wars, US debt ceiling.