Investor exposure
On each daily fixing, as long as the knock-out has not been hit:
- Long a forward at the strike (buys EUR 10,000 at $K$) -> vanilla (alone, a strip of forwards)
- Short an extra put at the strike (buys another EUR 10,000 at $K$ when the fixing is below $K$, i.e. the 2x leverage) -> vanilla (alone, a strip of puts)
- Short the knock-out (the whole strip stops at the first fixing $\geq$ KO level) -> exotic, makes every component path dependent
Equivalently: long a strip of up-and-out calls and short twice a strip of up-and-out puts, all struck at $K$ with the same knock-out barrier.
Termsheet (core components)
1Y EUR/USD Accumulator with daily Knock-Out, 2x leverage (Client buys EUR, sells USD), zero premium
- Spot reference = 1.1206 (9 October 2026)
- Strike = 1.0861 (96.9% of spot, zero-cost under Heston)
- Knock-out level = 1.1430 (102% of spot), observed at each daily fixing (discrete)
- Daily amount = EUR 10,000 if fixing $\geq$ strike, EUR 20,000 if fixing $<$ strike
- 260 daily fixings, monthly physical settlement
Calibration step
Heston calibrated to the whole CME Euro FX options surface.
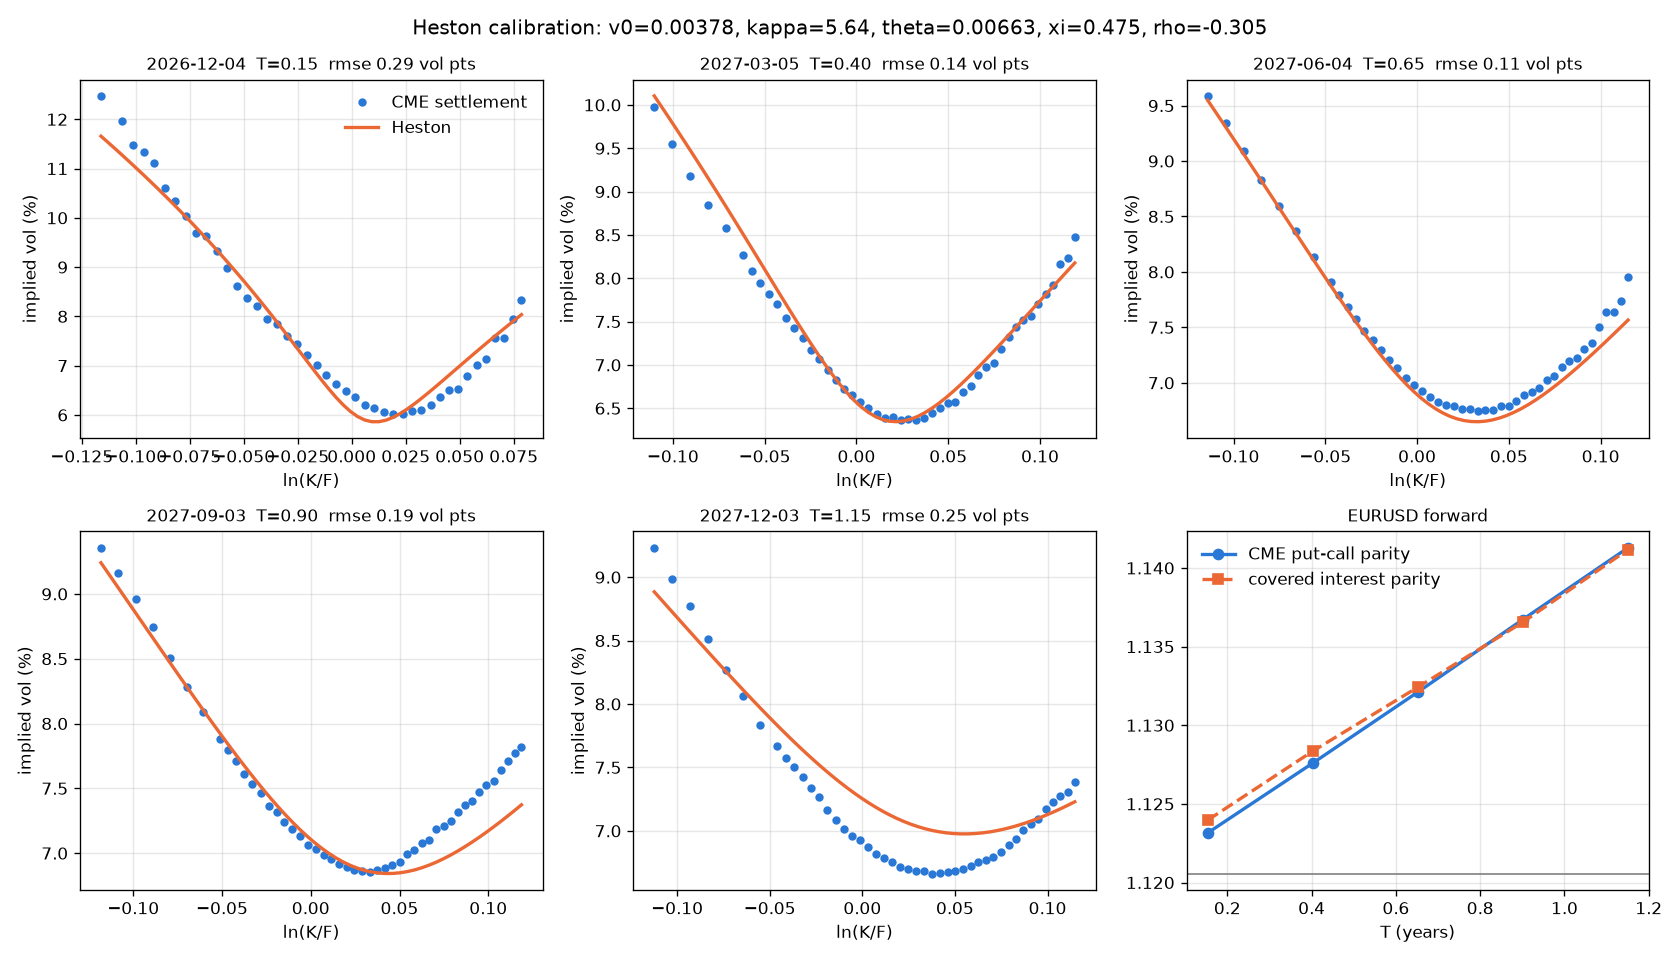
Note: in FX, a smile (both sides above the ATM vol) is the usual shape, unlike equity where the shape is mostly a one-sided skew. On top of it, the smile can be tilted to one side. The tilt depends on the currency pair and can change sign. Here, EURUSD is tilted towards EUR puts: when EUR falls, vol rises.
1/ Contractual terms
Question: Why does the 2x leverage below the strike, combined with the knock-out above spot, make the product structurally unfavourable for the client, even though the strike is 3% below spot?
My answer: Because the expected value of the gains is negative if we look at probabilities (can be estimated during the Monte Carlo step).
Feedback: partly correct. At the zero-cost strike the expected value is zero by construction, so the problem isn’t a negative mean. The problem is the asymmetry. Gains are small and capped (the knock-out ends the trade as soon as EUR rallies), while losses are doubled and uncapped when EUR falls below the strike. The result is frequent small gains and rare large losses, which is the shape of the PV histogram.
2/ Market data
Question: Why do we need both a USD and an EUR interest rate curve to price a EURUSD product, and which one do we use to discount the client’s P&L?
My answer: Some products that compose the structured products have USD as underlyings, other have EUR.
Feedback: incorrect. Both curves are needed because the forward is set by the rate differential (covered interest parity):
\[F = S \, e^{(r_{USD} - r_{EUR})T}\]Holding EUR instead of USD means earning EUR rates instead of USD rates. The client’s P&L is in USD, the quote currency, so it’s discounted on the USD curve.
3/ Forwards
Question: Put-call parity gives $C - P = DF \cdot (F - K)$. Why does that relation give us the forward without any model, and why is the 1Y EURUSD forward above spot here?
My answer: The put-call parity is simply a relationship that holds in the market, without any model, so the forward can be deduced from this relationship.
Feedback: half correct. The no-model part is right: long a call and short a put at the same strike is exactly a forward, so the forward follows by no-arbitrage. The second half is missing. The forward is above spot because USD rates ($\sim$4.4%) are higher than EUR rates ($\sim$2.9%), and the higher forward makes up for the lower interest earned on EUR. It is a carry effect, not a forecast that EUR will rise.
4/ Implied vols
Question: If you already have the option prices, why convert them into implied vols at all, and what does the smile tell you about EUR puts compared with EUR calls?
My answer: You convert the option prices to get the implied vol, because in practice that’s the non observable parameter that is traded. The smile says that, in FX, there are roughly equal downward and upward pressure to get protected (investors tend to buy a lot of DOTM puts as well as DOTM calls).
Feedback: first half OK, second half incorrect. Better: implied vol is a quoting unit that makes prices comparable across strikes and expiries, so you can see the smile at all. This data isn’t symmetric: EUR puts are clearly richer than EUR calls (Dec 26: 12.5% at $-12\%$ moneyness against $\sim$8% at $+8\%$), i.e. a negative risk reversal. The market pays more for protection against a falling EUR, and the client is short exactly that protection, twice over.
5/ Heston calibration
Question: What do the parameters $\rho$ (spot/vol correlation) and $\xi$ (vol of vol) each control in the shape of the smile?
My answer: The correlation between the spot/vol and the vol of vol are 2 parameters of the Heston’s SDE, hence they control the shape of the smile.
Feedback: too generic. What was expected:
- $\rho$ controls the skew (tilt). With $\rho < 0$, vol rises when spot falls, so downside puts get richer.
- $\xi$ controls the curvature (convexity). Higher $\xi$ makes both wings fatter.
For completeness: $\kappa$ sets how fast the smile flattens with maturity, and $v_0$/$\theta$ set the short- and long-term vol levels.
6/ Monte Carlo engine
Question: Why can’t we price the accumulator in closed form, as we can a vanilla, so that we need to simulate paths?
My answer: Because there are too many conditions / parameters that would make the PDE very difficult to solve.
Feedback: partly correct. The key concept is path dependence: the payoff depends on all 260 fixings and on whether the knock-out happened before each of them, not only on the final spot. Stochastic vol adds a second state variable. A 2D PDE is possible in principle, but Monte Carlo handles daily fixings, leverage and settlement much more simply.
7/ Payoff
Question: Why does a knock-out reduce the value of the structure to the client, and so let the bank offer a strike below the forward at zero cost?
My answer: The knock-out can terminate the product earlier, hence the investor would not have time to enjoy the life of the product. To compensate for this drawback, the price is more attractive and the strike costs nothing.
Feedback: right idea, wrong mechanism. The knock-out removes the client’s best scenarios: when EUR rallies, every fixing would be profitable, and that is exactly when the trade dies. In effect the client sells that upside to the bank. That premium, plus the extra puts sold through the leverage, pays for a strike below the forward. It’s a transfer of value, not compensation for a shorter life.
8/ Price
Question: What does “zero-cost strike” mean, and if the bank adds a sales margin, does the strike the client gets move up or down?
My answer: Zero-cost strike means that the bank can offer a strike below the forward at zero cost. I suppose that it doesn’t cost anything because the product involves buying a forward and selling options at the same time, which flattens the costs.
Feedback: second half good, first half and margin missing. The definition is the strike at which the structure’s PV is zero, so no premium changes hands upfront. The decomposition is right: a strip of forwards struck below the market (positive value for the client) is paid for by selling extra puts (the leverage) and the knock-out. With a sales margin, the strike moves up, which is worse for an EUR buyer.
9/ Compare
Question: Both models have the same 1Y at-the-money vol and both reprice it correctly, so why do they give different strikes, and what does that say about pricing path-dependent products?
My answer: The Black-Scholes model is especially bad to price options DOTM/DITM. ATM, prices are good and aligned with a Heston model.
Feedback: incorrect. Both models are calibrated to the same at-the-money vol, so they don’t differ because of an at-the-money vs out-of-the-money accuracy issue. Heston also fits the smile. The difference comes from the dynamics: how vol moves with spot over time (with $\rho < 0$ the knock-out comes later) and how the smile evolves going forward. The lesson is that two models matching the same vanillas can still price an exotic differently, which is model risk. That’s why the next step is local vol, and why desks use stochastic-local vol.