Objective: group data into $k$ clusters so that samples in the same cluster are close to each other w.r.t. the Euclidean distance.
The cost function consists in minimizing the inertia. The inertia is just the sum of all distances between the points and their associated cluster:
\[\operatorname{argmin} Inertia = \underset{C_1,...,C_k;\mu_1,...,\mu_k}{\operatorname{argmin}}\Sigma_{j=1}^k\Sigma_{i \in C_j}||x_i-\mu_j||^2\]Where $\mu_j$ is the mean, also called gravity center or cluster center:
\[\mu_j=\frac{1}{|C_j|}\Sigma_{i \in C_j}x_i\]Algorithm:
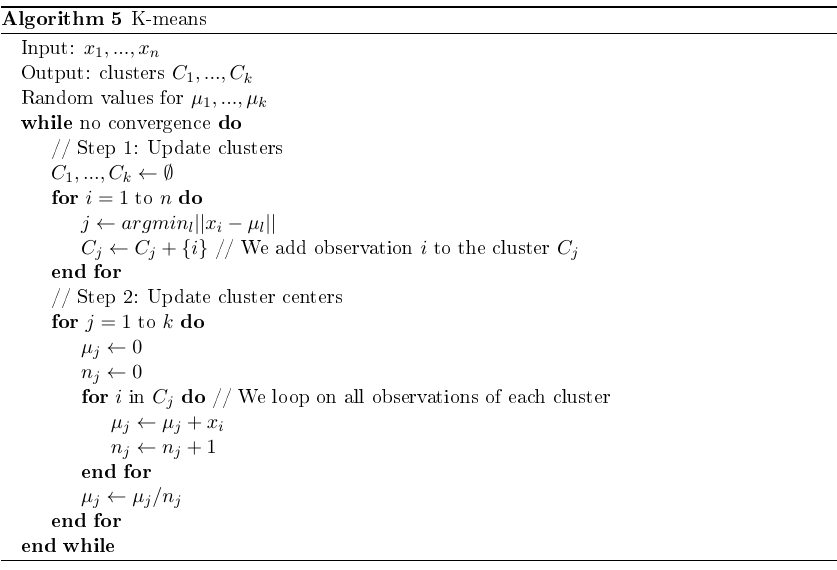
The while loop is important. If omitted, the clusters will be very close to the initial ones (usually randomly selected).
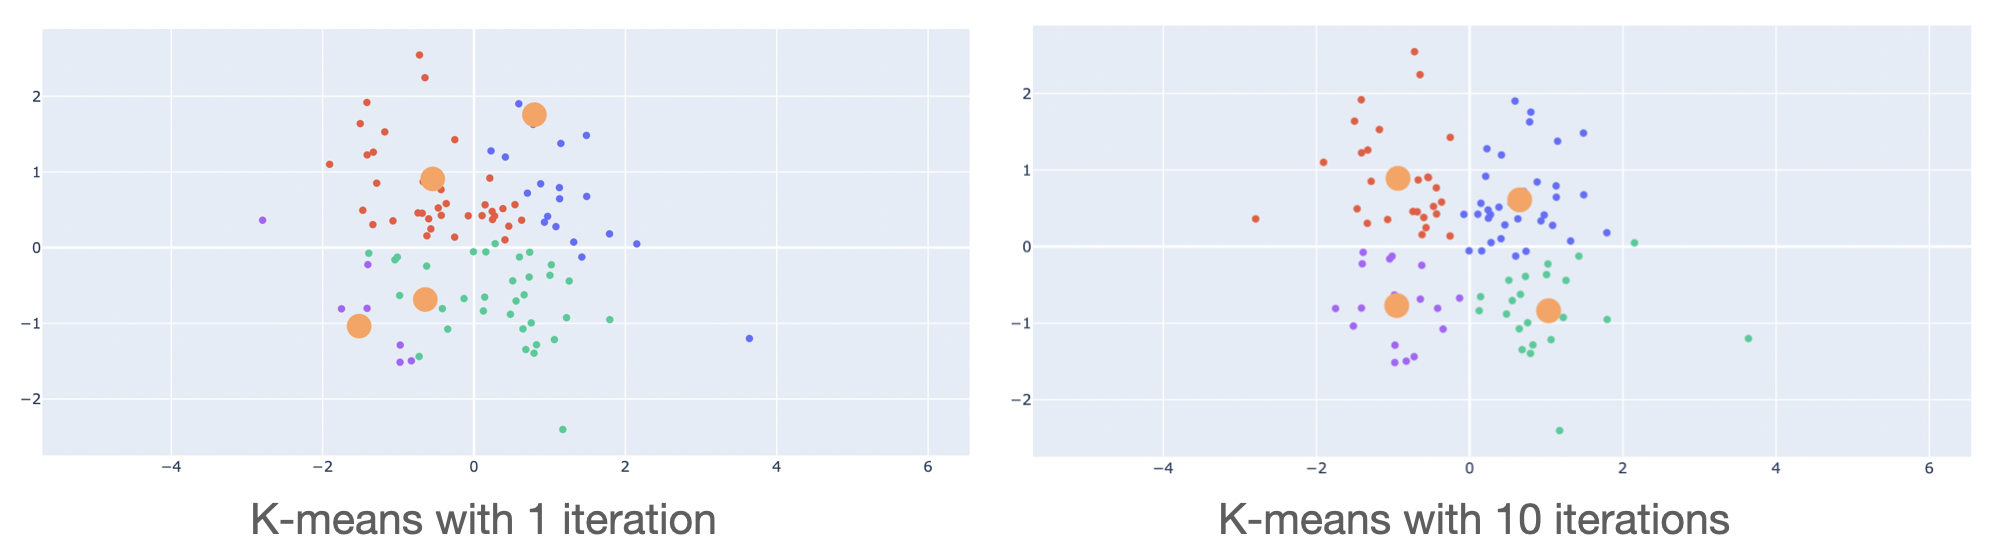
The quality of the clustering strongly depends on the initial center values. This is why the algorithm is generally run multiple times for different initial values. The best clustering (i.e., with respect to the metric we use) is returned.
Note: this problem is called NP-hard problem. It means that its complexity is at least equal to the complexity of an NP-problem
Note 2 : a problem is NP if it can be determined by a non-deterministic Turing machine in polynomial time. Intuitively, a problem is NP if we can quickly verify if one candidate is a solution of the problem. E.g. "travelling salesman problem" = let $d$ be a distance and $n$ be a number of cities. Is there an itinerary with distance $\ge d$ stopping by every city? -> easy to check
Turing machine (1936):
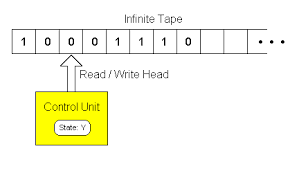
Note 3: “non-deterministic turing machine”: itinerary can be represented by a tree
K-means++
To improve the quality of the clustering, we choose the initial cluster centers far from each other:
The clearest explanation comes from Wikipedia:
-
Choose one center uniformly at random among the data points.
-
For each data point $x$ not chosen yet, compute $D(x)$, the distance between $x$ and the nearest center that has already been chosen.
-
Choose one new data point at random as a new center, using a weighted probability distribution where a point $x$ is chosen with probability proportional to $D(x)^2$. ==> we create a distribution where the probability to select an observation is the (normalized) distance between the observation and its closest cluster. Thus, to select a new cluster center, there is a high probability to select observations that are far from all already existing cluster centers. Similarly, there is a low probability to select observations that are close to already existing cluster centers.
-
Repeat Steps 2 and 3 until $k$ centers have been chosen.
-
Now that the initial centers have been chosen, proceed using standard k-means clustering.
centers = []
centers.append(X[np.random.randint(X.shape[0])]) # inital center = one random sample
distance = np.full(X.shape[0], np.inf) # a vector (n,1) with only infinity terms
for j in range(1,self.n_clusters):
    distance = np.minimum(np.linalg.norm(X - centers[-1], axis=1), distance) # size (n,1);
# distance = the smallest distance associated with the already existing centers
    p = np.square(distance) / np.sum(np.square(distance)) # probability vector [p1,...,pn]
# the highest probability in p is associated
# with the biggest distance w.r.t the already added centers
    sample = np.random.choice(X.shape[0], p = p) # one sample is
						 # selected according to probabilities
    centers.append(X[sample])
Silhouette
Assessing the number of clusters with inertia only would lead to an incomplete analysis since adding a cluster necessarily reduce the inertia (it takes only into account the distance intra-cluster and not inter-cluster).
The silhouette metric provides a balance between the compactness of a cluster and the distance to other clusters.
\[s(i) = \frac{b(i)-a(i)}{max(a(i),b(i))}\]$a(i)$: average distance of $i$ with the other points from the same cluster.
$b(i)$: average distance of $i$ with the other points from the closest cluster.
The silhouette coefficient is computed for each observation. The higher the silhouette coefficient, the better the observation is “clustered”. In other words, a high silhouette coefficient means that the observation is closed to observations of the same cluster and far away from observations of other clusters.

One way to assess the clustering quality is to look at the average of the silhouette scores of all observations.
We note that a good clustering quality requires $a(i) « b(i)$. If $a(i)>b(i)$ (and thus $s(i)<0$), $i$ is closer to observations from other clusters than from observations of its own cluster (which would be the result of a very bad clustering).
The denominator is used for normalization so that we have $-1 \leq s(i) \leq 1$.
Implementation
class MyKMeans():

    def __init__(self, n_clusters, n_iter, random_state=None, initialization='random'):

        self.n_clusters = n_clusters
        self.n_iter = n_iter
        self.random_state = random_state
        self.initialization = initialization

    def fit(self,X):

        n_rows = X.shape[0]
        n_cols = X.shape[1]

        rnd = np.random.RandomState(self.random_state)

        # 0- initiate cluster centers
        if self.initialization=='random':
            seeds = rnd.permutation(n_rows)[:self.n_clusters]
            cluster_centers = X[seeds, :]
        elif self.initialization=='kmeans++':
            cluster_centers = []
            cluster_centers.append(X[rnd.randint(X.shape[0])])
            distance = np.full(X.shape[0], np.inf)
            for j in range(1,self.n_clusters):
                distance = np.minimum(np.linalg.norm(X - cluster_centers[-1], axis=1), distance)
                p = np.square(distance) / np.sum(np.square(distance))
                sample = rnd.choice(X.shape[0], p=p)
                cluster_centers.append(X[sample])
            cluster_centers = np.array(cluster_centers)
        labels = np.zeros(n_rows)

        inertia_iter = []
        distances_best_cluster = []
        inertia_best = np.inf
        for j in range(self.n_iter):
            distances_best_cluster = []
            # 1- loop on all observations and find closest cluster
            for i in range(n_rows):
                distance_clusters = np.linalg.norm(X[i, :]-cluster_centers, axis=1)
                idx_cluster = np.argmin(distance_clusters)
                labels[i] = idx_cluster # closest center for the observation
                distances_best_cluster.append(distance_clusters[idx_cluster])
            inertia = np.sum(distances_best_cluster)
            inertia_iter.append(inertia)

            # 2- loop on all clusters to update the centers
            for k in range(self.n_clusters):
                cluster_center = X[np.where(labels==k)[0],:]
                cluster_centers[k,:] = np.mean(cluster_center, axis=0)

            if inertia < inertia_best:
                inertia_best = inertia
                cluster_centers_best = cluster_centers
                labels_best = labels

        return labels_best, cluster_centers_best, inertia_best, inertia_iter
See clustering-simulations.ipynb for more details.